Priority Candidates
0 visible
0 total
0 validated
205 seeds
0 max CQS
— coverage
SIGNATURE VIEWS — one click links physics + biology + translation. “Expert-ready” = not refuted by QA, shared genes consistent with the disease (qaGeneDisease = ok), and mechanistic fidelity MFS ≥ 0.9.
Bench-Ready
Strict / Balanced / Broad
First-Mover IP
Strict / Balanced / Broad
Restore-Safely
Strict / Balanced / Broad
Structural
Bypass Undruggable / Physics-Ideal Chokepoint / Cross-Domain Surprise
Convergence
Cohesive (z<−2)
Restraint
Handle With Care clear
Confidence & Clinical
Confidence Tier
Tier Rubric
CQS Quality Score
Genotype Fitness
Global Cross-Seed Recurrence
Clinical Pathway Family
Clinical Family Legend
Provenance & Integrity
Engine Architecture
Novelty (Relationship Type)
Content QA (dossier integrity)
Gene Attribution Integrity
Wet-Lab & Physics
Wet-Lab Assay Readiness (FSS)
AlphaGenome Impact
Target Canalization (Poincaré r)
Patent Prior-Art
Approval & Trials
Independent Check (Open Targets)
Thermodynamic State (S_VNE)
Clinical Toxicity Risk (ΔS_VNE)
Thermodynamic Toxicity
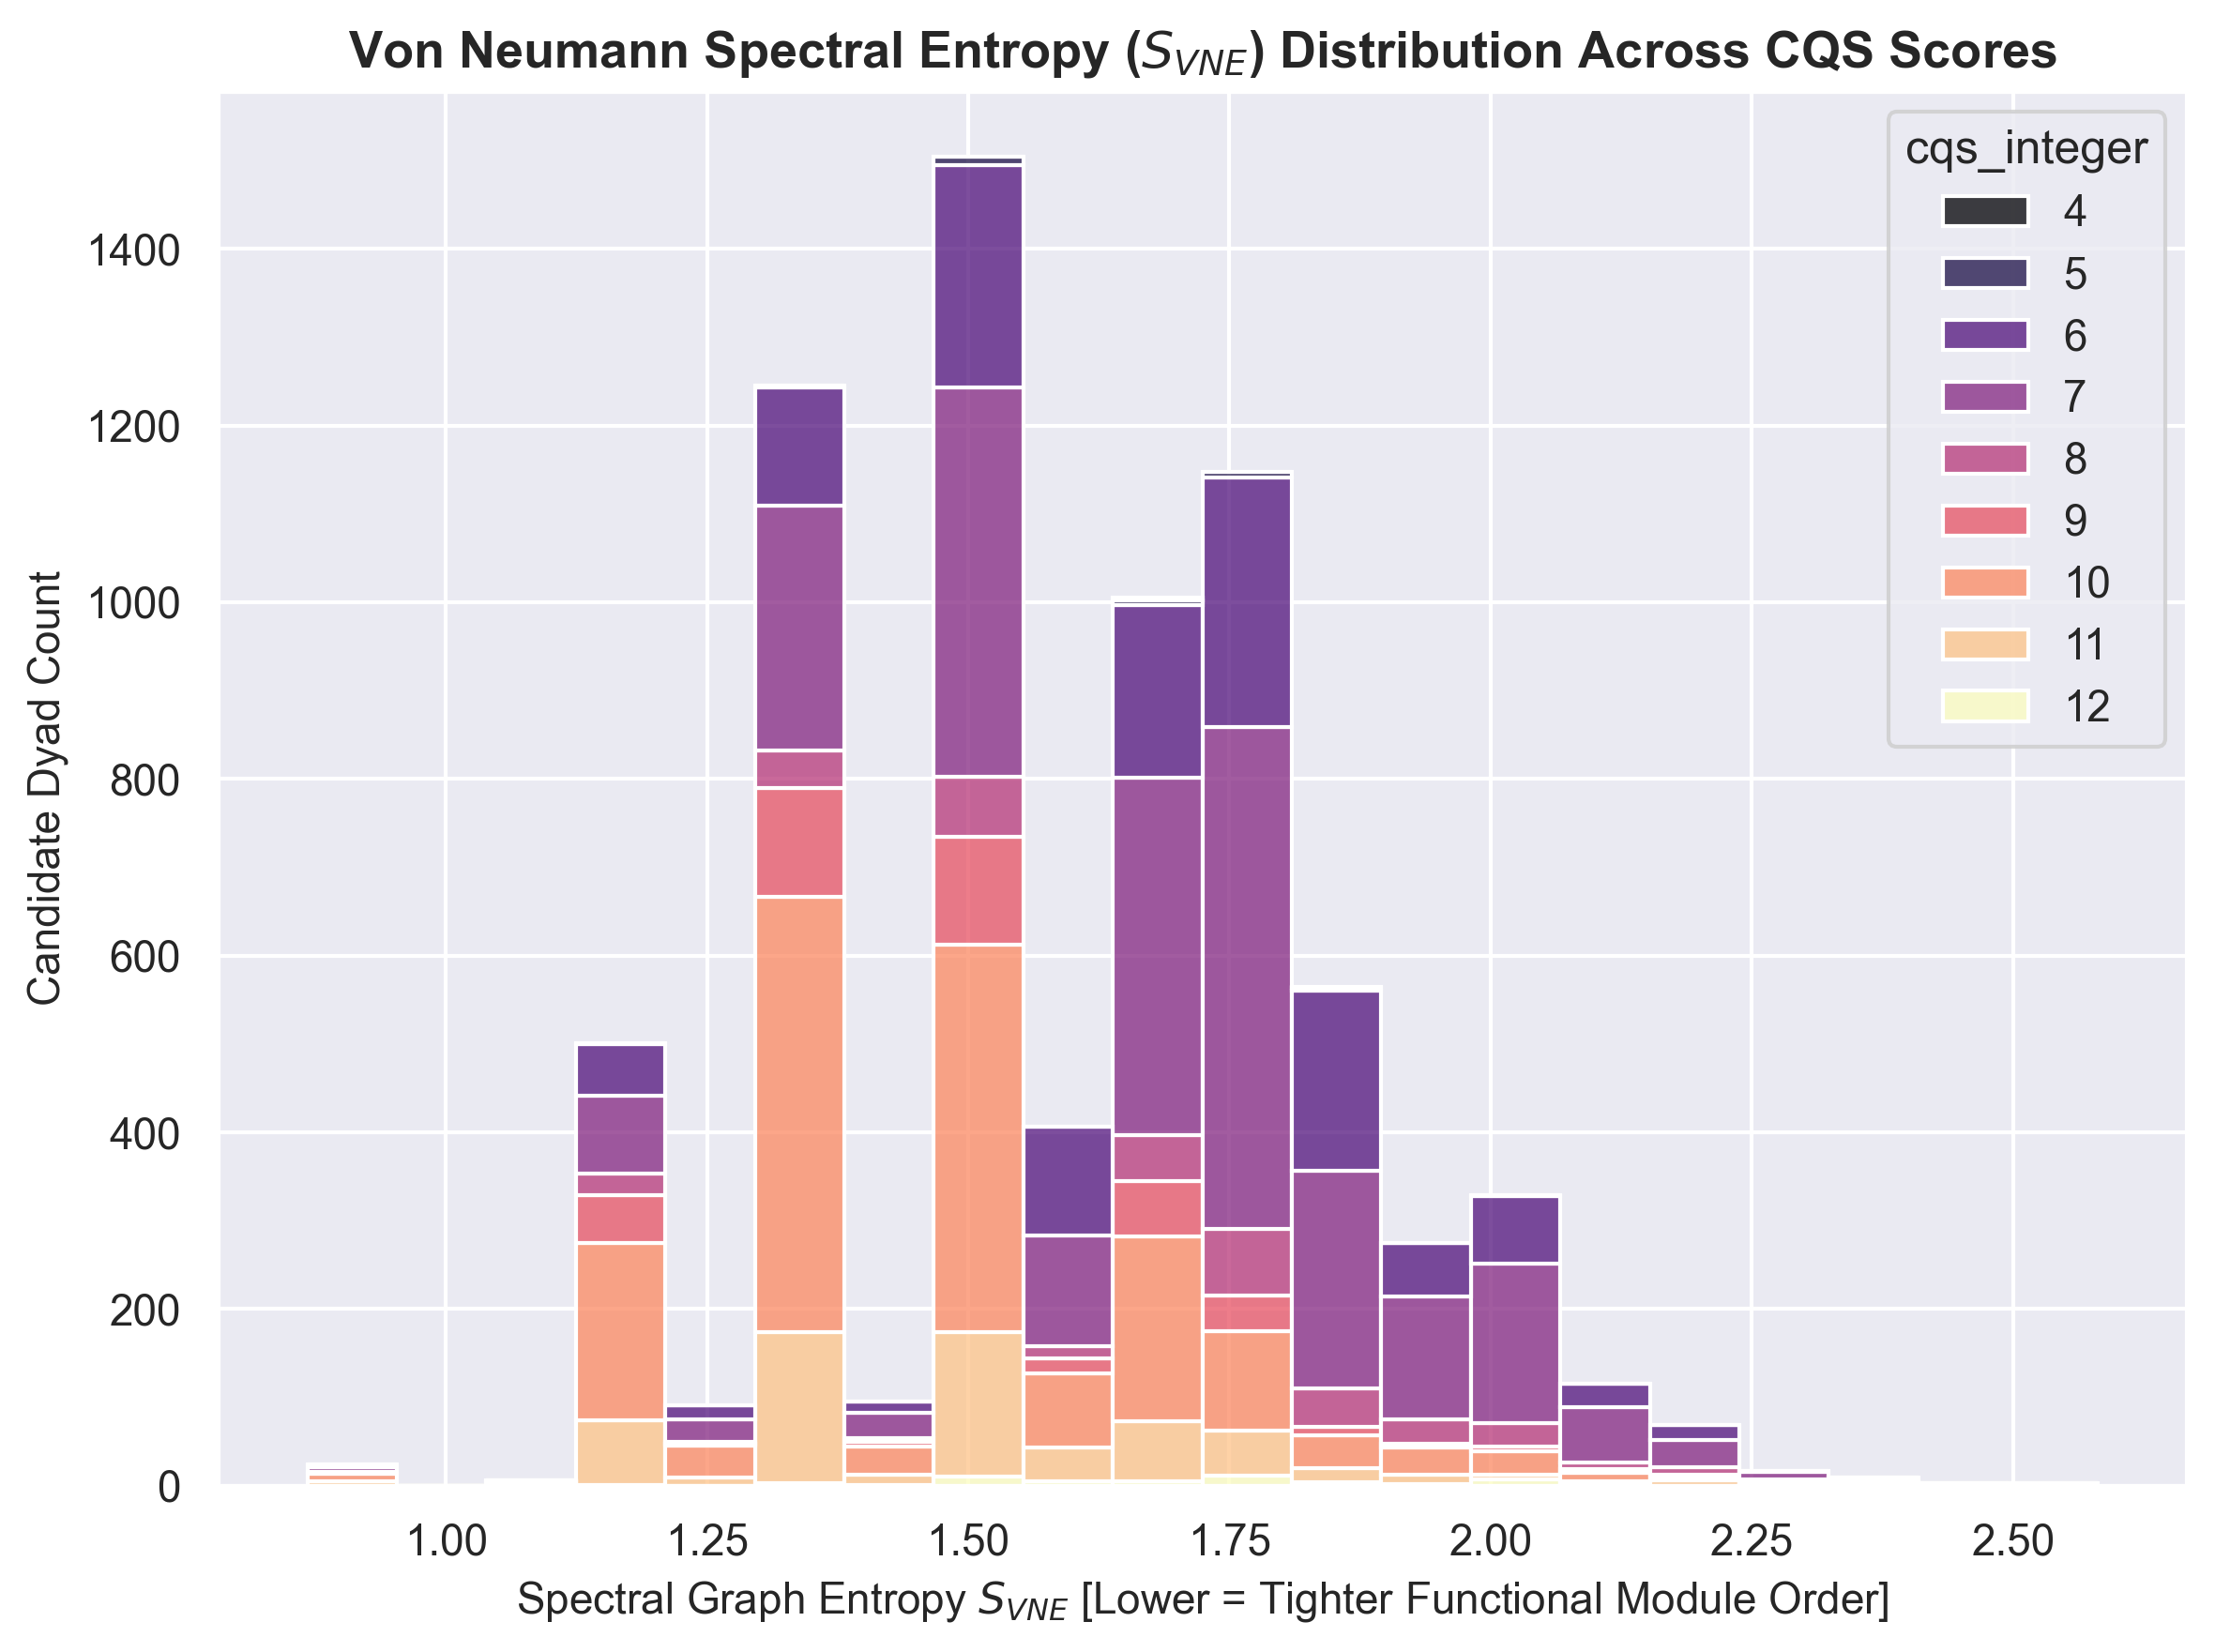
Distance from the global attractor well (S_VNE ≈ 1.524). High ΔS_VNE indicates a diffuse, high-entropy state prone to off-target clinical trial failure.
Mechanism & Convergence
Shared Pathways
Convergence Node Scope
Literature Verification (RANA)
Physical Interactome Proximity
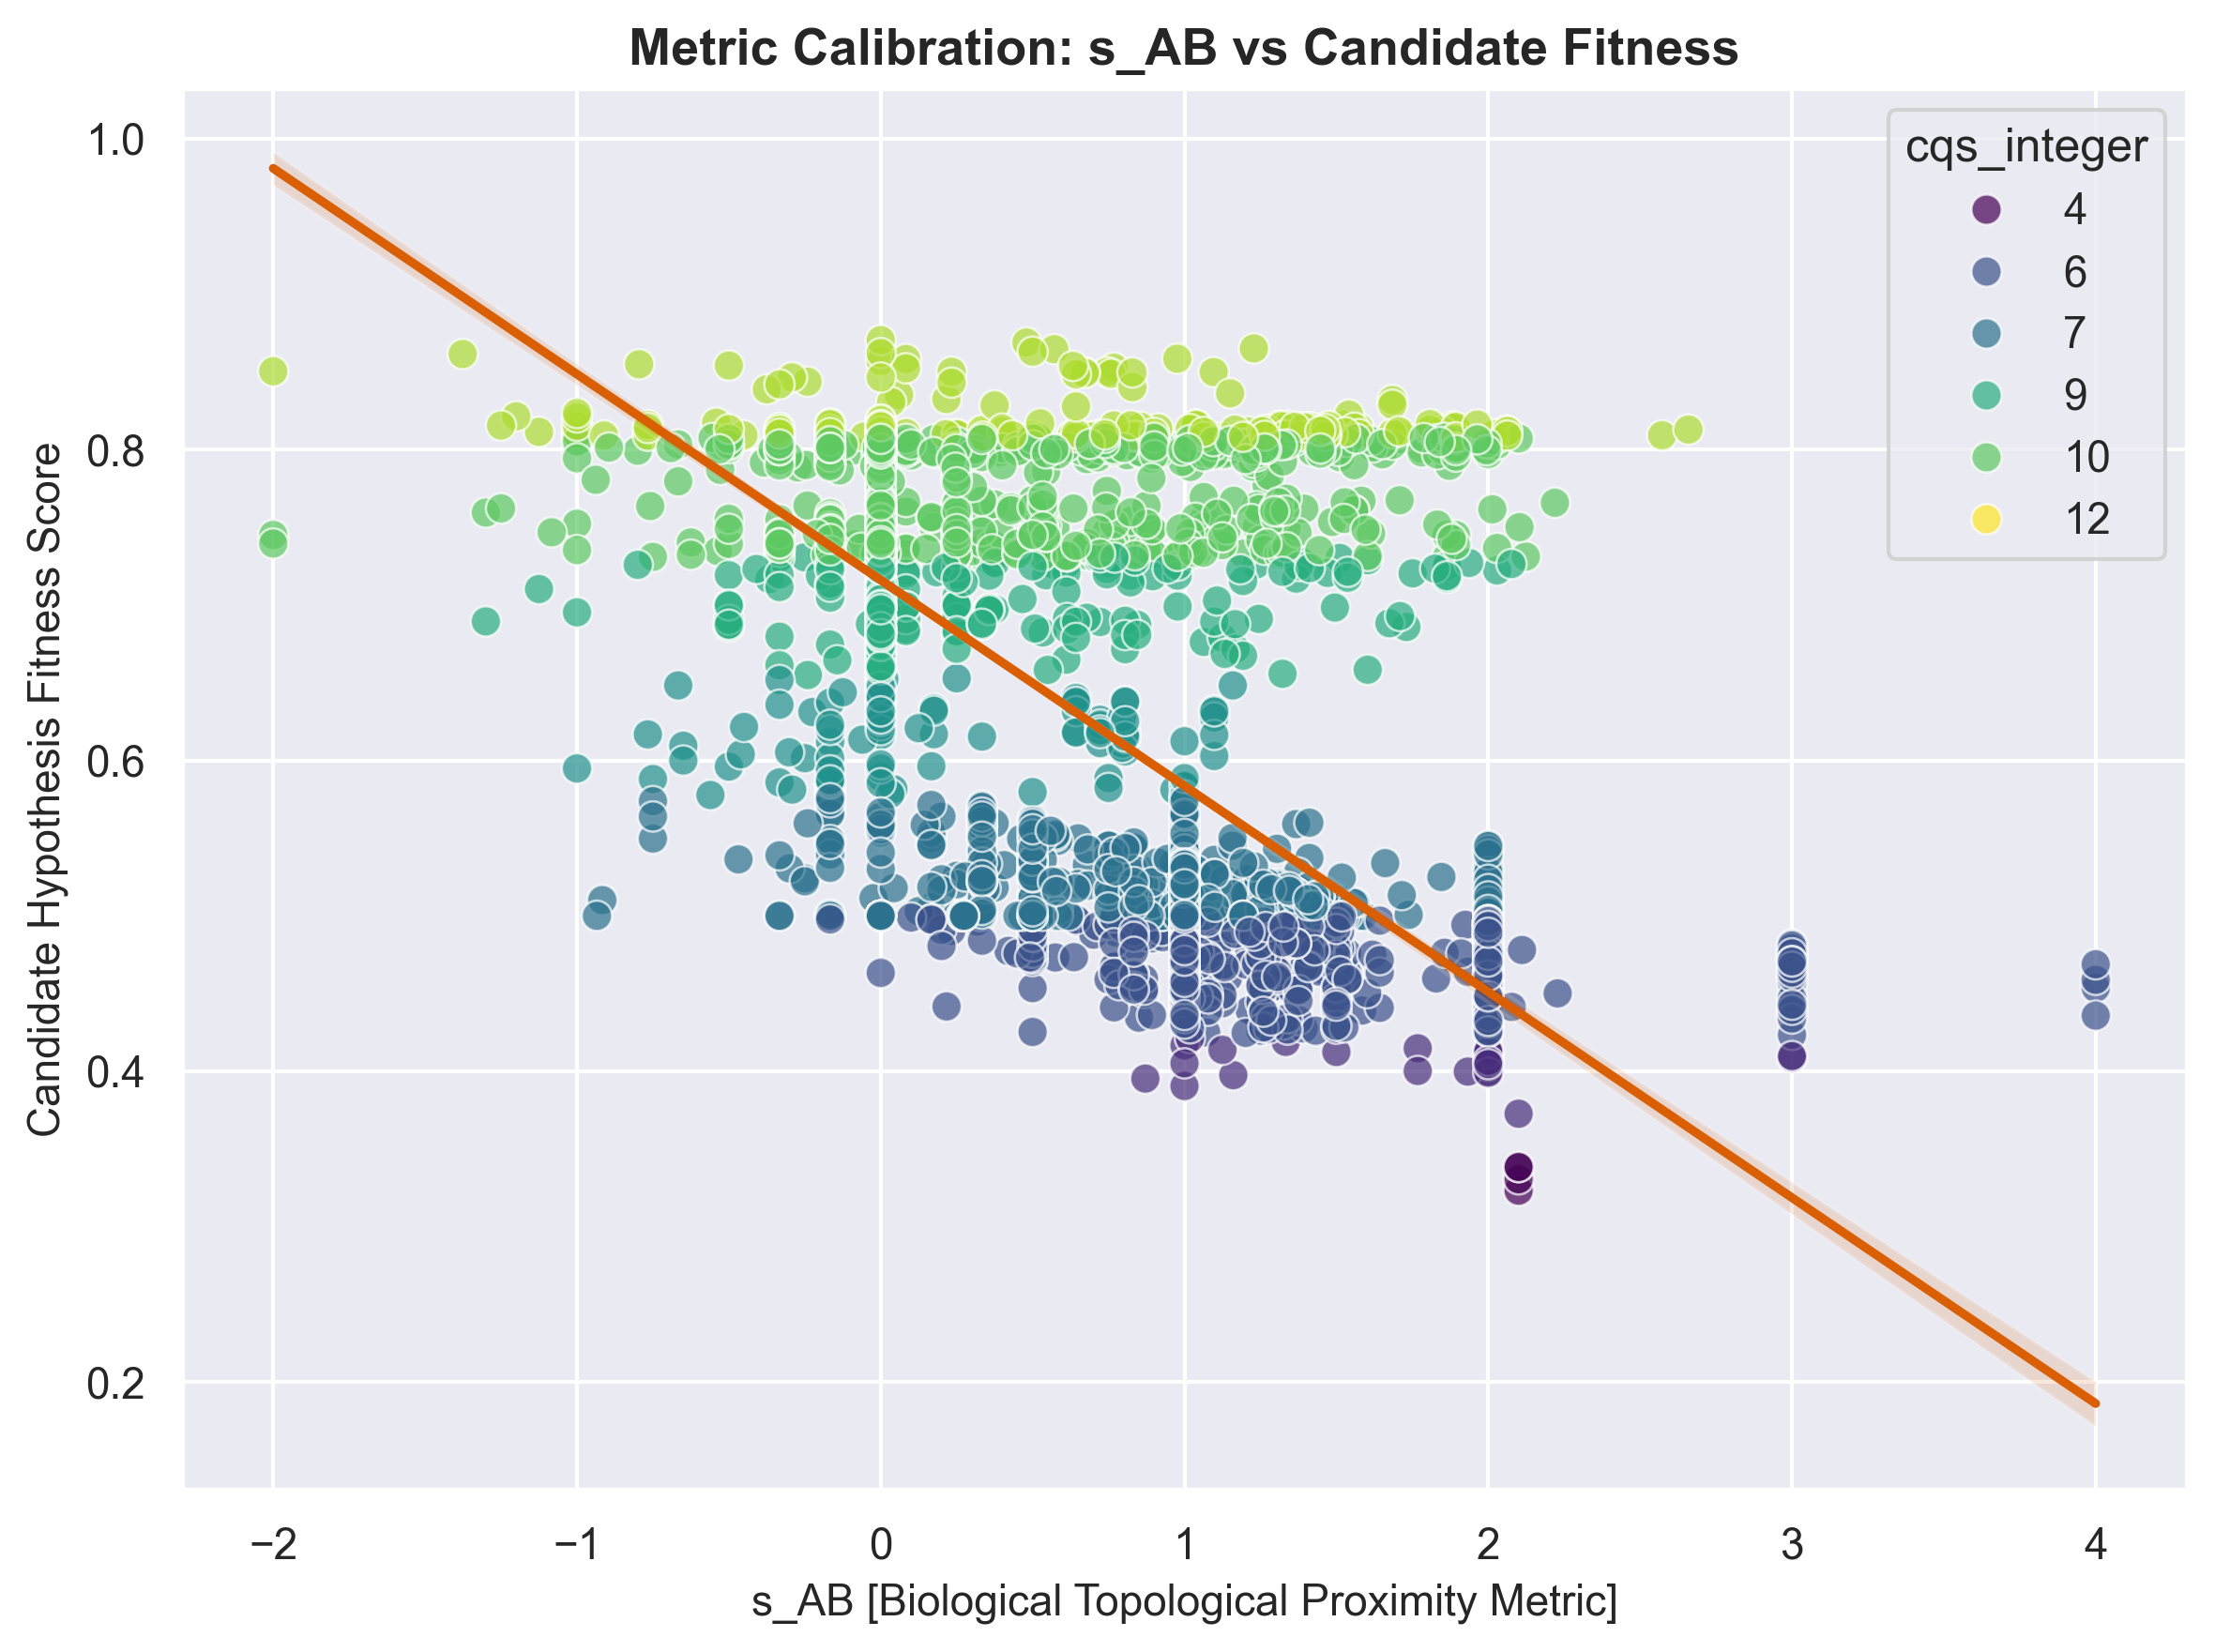
z is the interactome separation from the degree-preserving null (script 72); dyads with no real network test are excluded, not inferred. Overlap uses Menche s_AB on BioGRID.
Molecular Machine (convergence cluster)
Groups dyads by the molecular machine their shared gene belongs to (17 clusters). Counts are filter-aware: each shows how many candidates that machine has under your current filters, and they update as you change any filter.
Causal Chain Depth
Multi-Axis Chokepoint
Drug & Bottleneck
Drug Target Integrity
Mechanism Axis
Drug Specificity (Hub-Target)
Bottleneck Type (Chokepoint)
Gate 8 · Target Class Bypass
Gate 9 · Therapeutic Modality
Gate 11 · Developability & Safety
Patterns · Cross-Gate
Statistical Confidence
Presets & Translational
Presets (physics recipes)
✦ Neuro-Immunity Bridge (cGAS–STING)
✦ Lysosomal & Autophagy
✦ Bioenergetics / Mitochondrial
Hyper-Clusters (Elite 9)
Alzheimer's / Neuro Scout
Platt Lysosomal Precision
Discovery Frontier
Frances Platt Lens (LSDs)
Metabolite Bridges
Tightest Couplings
Deep Mechanisms
Allelic Calibration
Presets — one-click filter recipes
Hyper-Clusters: CQS ≥ 9, Rim r ≥ 0.5, Tight S_VNE ≤ 1.5.
Alzheimer's Scout: Neurologic, Goldilocks r, Tight S_VNE.
Platt Precision: Lysosomal + ChEMBL Drugs.
Discovery Frontier: sweet-spot bridge · multi-pathway · rim-specific · well-corroborated.
Alzheimer's Scout: Neurologic, Goldilocks r, Tight S_VNE.
Platt Precision: Lysosomal + ChEMBL Drugs.
Discovery Frontier: sweet-spot bridge · multi-pathway · rim-specific · well-corroborated.
Cross-Domain Status (v2.0)
Pharos Target Development Level (v0.6.0)
Therapeutic Axis
GTEx v10 Expressed Tissue (v0.7.0)
Approved Small-Molecule Overlay (ChEMBL)
Top Convergence Nodes
Loading...
Top Connected Genes
Loading...
Top Repurposing Drugs
Loading...
Loading...